A memo on what not to do in Open Data
Table of Contents
This post was originally published in French on 28 September 2017.
The aim of this post is to draw up a short (and therefore necessarily incomplete) list of “don’t do this” for open data producers. That is to say, all the things that can slow down or complicate the reuse of data from a technical point of view, or even prevent it.
To do that I am going to use a real example, Datainfogreffe, which is an interesting textbook case since you can find a lot of mistakes to avoid in it. Having used their data for some time now, I felt the need to express my dismay in a post. The goal is to make data providers aware of the importance of data quality (and why not get a reaction out of Datainfogreffe along the way …). To my mind, doing Open Data does not come down to putting a few CSV files online!
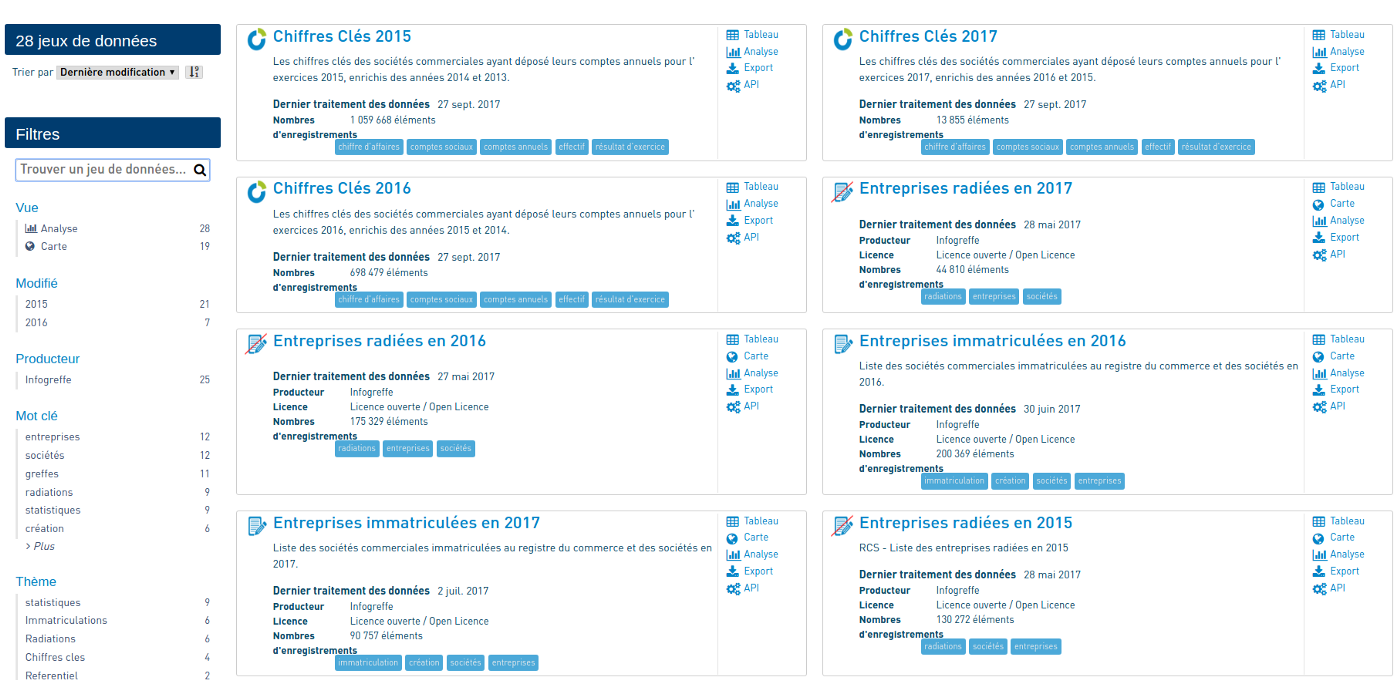
Infogreffe is a service that publishes legal and official information about French companies. Datainfogreffe is the platform that makes this data available. Paid access to the APIs is offered through a credit system. To our great pleasure, part of the data is however available as Open Data through the OpenDataSoft platform. These datasets, one per year, cover in particular:
- Company registrations
- Company deregistrations
- Key company figures (revenue, net income, headcount, etc)
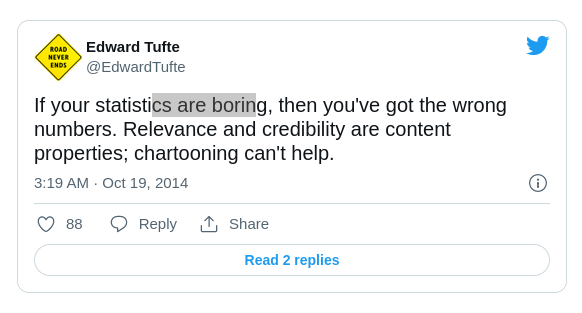
[edit] Despite the problems found in the Datainfogreffe open data, it remains a very rich, useful and unique source of information about companies in France!
So let’s pick all of this apart and try to identify the problems with this data.
The structure of the datasets #
I will not dwell on the format of the files offered by Datainfogreffe: the datasets can be exported as CSV and that format seems perfectly suitable to me, as it is very simple to work with.
For each of the 3 categories of data, we have one file per year (from 2012 to 2017 for company deregistrations and registrations, and from 2014 to 2017 for the key figures).
Columns disappear over the years #
In the case of yearly datasets, a column that exists in year N should also exist in year N+1. In other words, we should not see a column disappear over the years.
On Datainfogreffe, in the company registration files, the business sector is filled in from 2012 to 2015, but that is no longer the case from 2016 onwards. Not handy if we want to run a study on how company creations by business sector have changed, for example.

Columns are created over the years #
Conversely, a column that exists in year N should exist in year N-1. We can soften this point a little, since these can be new variables that did not exist before.
For example, in the Datainfogreffe key figures files, the INSEE code of the company’s département (the French administrative division), “Num. dept.”, only exists from 2015 onwards.

Columns are renamed over the years #
Variables should not change name between the year N dataset and the year N+1 one. Ideally, the columns should not be reordered between two years either.
At Datainfogreffe, quite a few liberties are taken on this point: depending on the year, you get “Code activité (APE)” and “Code APE”, “Date immatriculation” and “Date d’immatriculation”, “Date radiation” and “Date de radiation”, etc. It is easy to see how this can be a serious obstacle to automating the import of every year of data, for instance.

Column naming is not consistent #
The column naming within a single dataset should be consistent: for example, if one column is singular, the others should be too. If one column is written in snake_case, all the columns should follow that format.
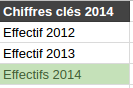
This point can be illustrated with the 2014 Datainfogreffe key figures dataset, in which you can find a column Effectif 2013 and a column Effectifs 2014.
The datasets contain “junk” columns #
By junk column, I mean a column whose name or documentation does not let you know what it contains.
On Datainfogreffe, you can for example find a column called test1 in the 2016 and 2017 key figures, or a column Column 28 in the 2014 key figures. I challenge you to explain what is in them.
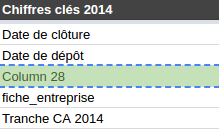
[edit] Following the publication of my article, Datainfogreffe cleaned these “junk” columns out of the various datasets.
The yearly datasets contain several years of data #
Datasets can contain several years of data provided there is a clearly identified année variable in the dataset, with each row of data linked to one and only one year. A less clean alternative is to build as many columns as there are years for a given variable.
Where the files are broken down by year (one file per year), we naturally do not expect to find several years of data inside a single dataset.
At Datainfogreffe, in the key figures files, we find year N, but also year N-1 and year N-2.
For example, the 2014 key figures file also contains the data for 2013 and 2012. So we find the variables CA 2012, CA 2013, CA 2014 (CA stands for chiffre d’affaires, the revenue).
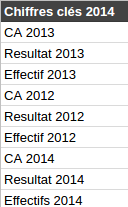
Since each dataset repeats the data of years N-1 and N-2, there is duplicated information between the files. For example, the 2015 revenue will be present in the 2015, 2016 and 2017 files.
Let’s check with R that we really do have the same 2015 revenue in the 2015 and 2016 files:
library(tidyverse)

mainIndicators2015 <- read_csv2('chiffres-cles-2015.csv')
mainIndicators2016 <- read_csv2('chiffres-cles-2016.csv')

mainIndicators <- inner_join(mainIndicators2015, mainIndicators2016, by = 'Siren') %>%
  select(Siren, `CA 1.x`, `CA 2.y`)

mainIndicators

mainIndicators %>%
  filter(`CA 1.x` != `CA 2.y`)
# A tibble: 615,482 x 3
       Siren `CA 1.x` `CA 2.y`
       <chr>    <int>    <int>
 1 349735860   225480   225480
 2 349737460    44630    44630
 3 349738856   348060   348060
 4 349742130       NA       NA
 5 349745414       NA       NA
 6 349746420   707978   707978
 7 349746529  1017859  1017859
 8 349748442       NA       NA
 9 349749911       NA       NA
10 349751081 12755788 12755788
# ... with 615,472 more rows

# A tibble: 6,486 x 3
       Siren `CA 1.x` `CA 2.y`
       <chr>    <int>    <int>
 1 349805457  2805204  2805000
 2 325165579   190968   190000
 3 324925296   867013   867000
 4 324977735  1537350     1537
 5 325165579   190968   190000
 6 325184513  1796937  1796000
 7 324042761   367849   652223
 8 324716026  1442909  1442000
 9 324716141  4000171  4000000
10 301670816   394720      395
# ... with 6,476 more rows
The result is damning: we have 6,486 companies out of 615,482 for which we do not have the same 2015 revenue! And some of the differences are … striking: the 2015 revenue goes from €1,537,350 to €1,537 between the two files. Hmm, it looks like something got divided by 1,000 between the two … When you are faced with cases like this, which file are you supposed to “believe”?
Seven months later, these oddities still have not been corrected or explained by Datainfogreffe.
The columns do not let you identify the year the values belong to #
If you choose to store several years in the same file in different columns, the column name has to identify the year clearly.
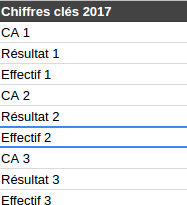
In the key figures files after 2015, we do not even know which years the columns correspond to, since we get naming like “CA 1”, “CA 2”, “CA 3”. Very handy …
Mixing apples and oranges … #
A dataset should only contain data related to the topic of that dataset. Makes sense, right?
Not for Datainfogreffe. In the 2017 deregistrations and registrations, you can find information … about the key figures (revenue, income, headcount). As if these variables were not already present three times over in the key figures datasets themselves.
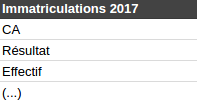
By the way, let’s go and check what the CA column contains in the 2017 registrations dataset:
newCompanies2017 <- read_csv2('entreprises-immatriculees-2017.csv')

newCompanies2017 %>%
  filter(!is.na(CA)) %>%
  select(Siren, CA)
# A tibble: 1 x 2
      Siren    CA
      <int> <chr>
1 399323914  5046
Strange: there is exactly one single company with a non-empty revenue out of the 129,236 companies in the file of companies registered in 2017.
Some columns are duplicated #
A column should appear only once with a given name in a file; there should be no duplicates.
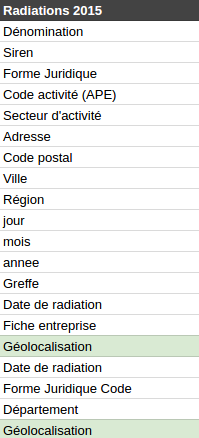
On Datainfogreffe, you can for example find this problem in the 2015 company deregistrations, where we are treated to 2 Géolocalisation columns, and also 2 Date de radiation columns.
closedCompanies2015 <- read_csv2('entreprises-radiees-2015.csv') %>%
  select(Siren, `Géolocalisation`, `Géolocalisation_1`, `Date de radiation`, `Date de radiation_1`)

closedCompanies2015 %>%
  filter(`Géolocalisation` != `Géolocalisation_1`)

closedCompanies2015 %>%
  filter(`Date de radiation` != `Date de radiation_1`)
# A tibble: 0 x 5
# ... with 5 variables: Siren <int>, Géolocalisation <chr>, Géolocalisation_1 <chr>, Date de radiation <date>, Date de radiation_1 <date>

# A tibble: 0 x 5
# ... with 5 variables: Siren <int>, Géolocalisation <chr>, Géolocalisation_1 <chr>, Date de radiation <date>, Date de radiation_1 <date>
At least the values in the duplicated columns are identical.
The same information is present in different formats #
A piece of information should be present only once in a dataset, in the form that is the easiest to work with. There is no point in having the same information in different formats.
Datainfogreffe illustrates this point very well in the 2015 company deregistrations, where we have a Date de radiation column but also 3 columns jour, mois, annee carrying the same information. That is completely useless, and it increases the file size for nothing.
Just in case, let’s check the consistency between these two variables with R:
closedCompanies2015 <- read_csv2('/home/vbroute/Téléchargements/entreprises-radiees-2015.csv') %>%
  select(Siren, `Date de radiation`, jour, mois, annee)

closedCompanies2015 %>%
  mutate(
    date1 = ymd(`Date de radiation`),
    date2 = ymd(paste(annee, mois, jour))
  ) %>%
  filter(date1 != date2)
# A tibble: 46,407 x 7
       Siren `Date de radiation`  jour  mois annee      date1      date2
       <int>              <date> <int> <int> <int>     <date>     <date>
 1 409955838          2015-08-07     8     7  2015 2015-08-07 2015-07-08
 2 422861054          2015-08-07     8     7  2015 2015-08-07 2015-07-08
 3 431905512          2015-08-07     8     7  2015 2015-08-07 2015-07-08
 4 433752623          2015-08-07     8     7  2015 2015-08-07 2015-07-08
 5 435198932          2015-08-07     8     7  2015 2015-08-07 2015-07-08
 6 437993900          2015-08-07     8     7  2015 2015-08-07 2015-07-08
 7 437933278          2015-08-07     8     7  2015 2015-08-07 2015-07-08
 8 441522828          2015-08-07     8     7  2015 2015-08-07 2015-07-08
 9 444694061          2015-08-07     8     7  2015 2015-08-07 2015-07-08
10 452440704          2015-08-07     8     7  2015 2015-08-07 2015-07-08
# ... with 46,397 more rows
Bingo: there are 46,407 rows out of 130,272 in which the dates are not the same depending on whether you use the Date de radiation column or the jour, mois and annee columns. It looks like an inversion between the days and the months in one of the two variables … but which one?
Data quality #
To offer a good quality dataset, you need good quality data: checked, validated, and so on. Since the data is open, it is likely to be transformed and republished by many users, who do not necessarily want to publish wrong information.
We have already spotted a lot of inconsistencies in the key figures and the deregistration dates, and we can carry on a little, for fun.
For example, the geographic coordinates of the companies are completely wrong: they do not correspond to the location of the company, but to the location of the centre of the town it is based in. Let’s test it on the Rennes companies deregistered in 2015:
closedCompanies2015 <- read_csv2('entreprises-radiees-2015.csv') %>%
  select(Siren, `Géolocalisation`, `Code postal`)

closedCompanies2015 %>%
  filter(`Code postal` == '35000')
# A tibble: 355 x 3
       Siren              Géolocalisation `Code postal`
       <int>                        <chr>         <chr>
 1 384982047 48.1116364246, -1.6816378334         35000
 2 788545127 48.1116364246, -1.6816378334         35000
 3 504870775 48.1116364246, -1.6816378334         35000
 4 791212269 48.1116364246, -1.6816378334         35000
 5 523084986 48.1116364246, -1.6816378334         35000
 6 788994747 48.1116364246, -1.6816378334         35000
 7 479507808 48.1116364246, -1.6816378334         35000
 8 511016297 48.1116364246, -1.6816378334         35000
 9 403610736 48.1116364246, -1.6816378334         35000
10 530015577 48.1116364246, -1.6816378334         35000
# ... with 345 more rows
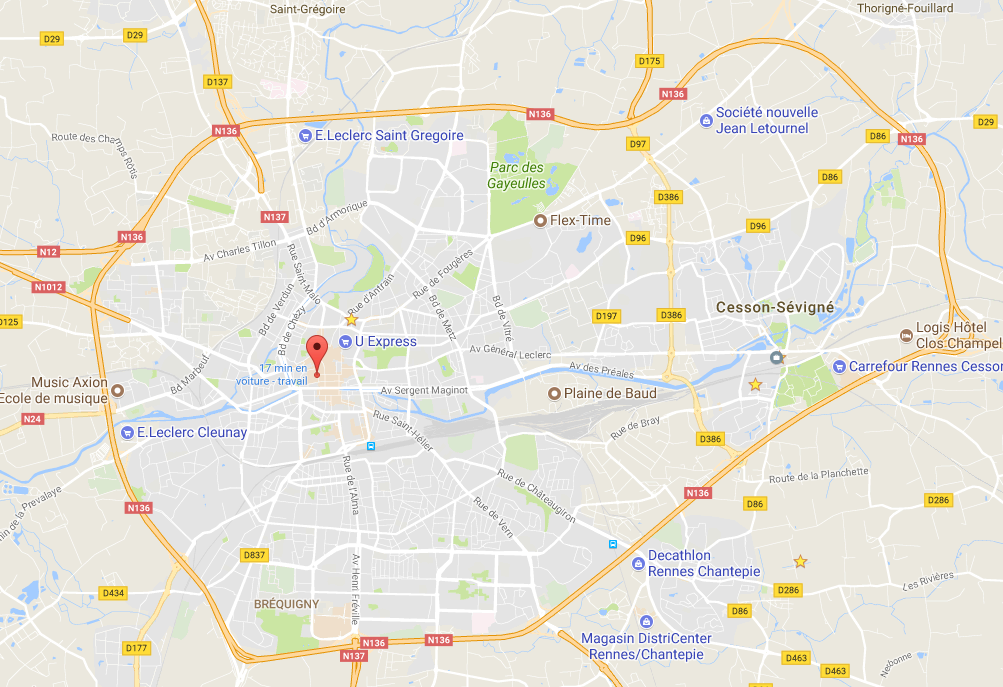
According to Datainfogreffe, the 355 companies deregistered in Rennes in 2015 are all located at the point (48.1116364246, -1.6816378334). They must have been a bit cramped …
Still in the same dataset, let’s go and take a look at the postcodes, to see what is hiding there. A postcode contains 5 digits, so let’s look at whether any of them break that rule:
closedCompanies2015 <- read_csv2('entreprises-radiees-2015.csv') %>%
  select(Siren, `Code postal`)

closedCompanies2015 %>%
  filter(str_length(`Code postal`) != 5)
# A tibble: 126 x 2
       Siren `Code postal`
       <int>         <chr>
 1 529857021        FL 333
 2 790120745          3530
 3 398308874        WIMODD
 4 407777010          1030
 5 805013141          2035
 6 448367599          4070
 7 794245241             .
 8        NA      SOISSONS
 9 804722460          1140
10 484651443          8050
# ... with 116 more rows
Clearly, I do not have the same idea of what a postcode is as Datainfogreffe. I will stop there, but if you dig a bit, you will very probably find plenty of other oddities in this data.
Such errors in public data are all the more serious because they concern companies. Publishing false data can harm them. Imagine publishing a revenue divided by 1,000 for a company? Or saying that a company is closed when it is not? (if you look carefully, you will find some in the 2017 deregistration file …)
Updating the data #
A good quality dataset is one that is updated regularly. For yearly data, you expect one update per year.
Datainfogreffe’s intention is commendable, in that the current year’s datasets are updated as the year goes on. It becomes a problem when those updates stop part-way through the year … At the time of writing (26 September 2017), the 2017 deregistrations dataset has not been updated since May, and the 2017 registrations one has not been updated since July.
[edit] After checking, it turns out that the 2017 deregistration and registration data is indeed updated regularly. The site and the API, on the other hand, both show completely out-of-date update dates for these 2 datasets.
Structural changes over time #
The structure of an Open Data dataset should only be allowed to change on the condition that those changes are extremely well documented and that users are informed of them.
When you build a study based on one or more datasets, it is really irritating to re-run the code a few weeks later and find that the whole structure of the files has changed, and that you have to play a guessing game to work out what modifications were made.
At Datainfogreffe, I have lost count of the structural changes of all kinds. I have even spotted data being removed: not so long ago we had access to the 2011 key figures, which is no longer the case today.
Documentation #
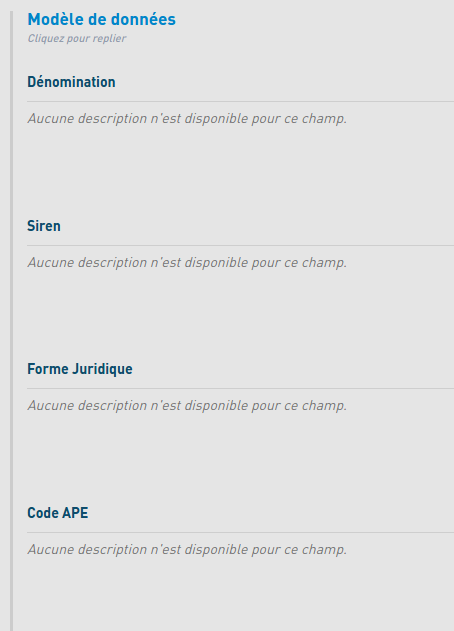
The documentation that has to come with the data is of course essential. You will find a good example of documentation with the base SIRENE, the French national business register, which happens to be really complete: a description of each field, the possible values, the type of the values, the length, etc.
Datainfogreffe, on the other hand, has virtually no documentation for its datasets.
The (mutual) help offered to data users #
On top of good documentation, it is important to offer a public space (comment system, forum, etc) where data users can ask questions to the producers (or to other users). The benefit of a public discussion space over a simple contact form is of course that the answers are shared and can be read by everyone.
Unfortunately, on Datainfogreffe, only a contact form is available. (has anyone ever had a reply?)
To conclude … #
The rise of Open Data now gives us access to an abundance of open data of all kinds, on a great many topics, and that is a good thing. Still, for this mass of data to be understood and used by users (without which it is of no use at all), quality has to be at the centre of the producers’ concerns.
Data quality matters all the more when wrong information can directly harm the entities concerned (companies, towns, schools, etc). So producers must not lose sight of the fact that their data is likely to be republished in many formats, through many channels and in very varied contexts.
My impression is that over time this is generally going in the right direction, but we need to keep supporting, training and equipping providers so that the quality of open data keeps improving.
For example, the SIRENE database, opened at the beginning of 2017, is of very good quality to my mind. The file structures are clear and well documented, the updates (twice-yearly, monthly and daily) are kept up, there is a discussion space available through the data.gouv.fr platform, the French government’s open data portal, etc.
So I invite Datainfogreffe to embrace the right path of Open Data’s evolution by correcting the many problems I have found in the datasets, in order to end up with a rich, good quality source of information.