Some maps are packaged with jQuery Mapael and some others are available on the mapael-maps repository (feel free to contribute to this repository!). In this tutorial, I will explain how to create a new map for jQuery Mapael from an existing SVG file. Let’s create a United Kingdom map for Mapael!
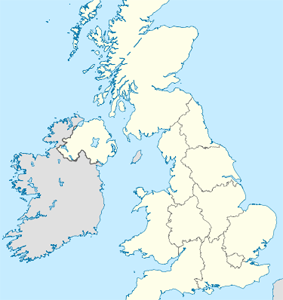
The first step is to find an SVG map file. You can find many maps in SVG format with a Creative Commons license on the web. You can find this kind of resource on Natural Earth Data or Wikimedia Commons. A map is based on a specific projection such as the Mercator, Miller, Lambert or equirectangular projection. Here is a list of map projections.
If you want to plot cities by latitude and longitude on your map, you have to pay attention to the projection used by the chosen map. Indeed, the algorithm to convert a latitude and a longitude to x and y coordinates depends on the map projection. The simplest projection is the equirectangular one (see below for more information).
Here is the map of the United Kingdom with an equirectangular projection and in SVG format.
Inkscape is a powerful Open Source tool to edit vector graphics. It will allow us to clean the map by removing unwanted SVG paths, groups and SVG transformations, and by trimming the map. Thus, we will be able to extract only the wanted paths that compose the map.
Go to File > Inkscape Preferences > Transforms. Ensure that “Optimized“ is checked for the “Store transformation” option. It will force Inkscape to translate SVG transforms (such as translations, rotations, …) into coordinates within the paths.
All we want to retrieve from the SVG file are the paths of each county that will compose our map. We do not want lakes, rivers, small islands or neighbouring countries. You can remove all these unwanted elements.
The paths may be grouped within SVG <g> elements. As transformations can be applied to SVG groups, we have to ungroup all groups from the SVG file. Ungrouping all objects will make Inkscape translate transforms into coordinates within the paths. In order to ungroup all groups, open the XML editor (edit > XML editor) and, for each <g> element found in the XML tree, click on Object > Ungroup.
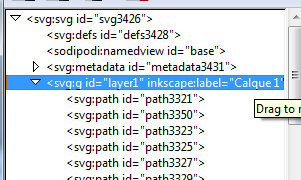
Ungroup all groups through the XML editor
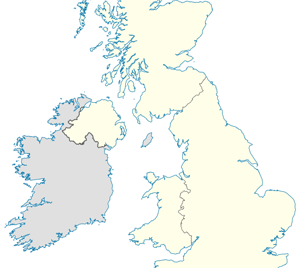
Cleaned map
Once your SVG file is cleaned from all unwanted elements and all groups are ungrouped, you may be faced with two cases:
First case: the SVG file contains paths that already correctly represent the different areas of the country. In such a case, you just have to select all the wanted areas (by holding CTRL + Shift pressed) and copy them in a new Inkscape document.
Second case: The SVG file contains paths that do not match the areas (for example, the file can contain paths just for the boundaries). In such a case, you can use the "Fill bounded areas" tool:  . Set appropriate values for the “Threshold” option (you can set it to 0 if the concerned area has a single color) and the "grow/shrink" option. Ensure that you have zoomed your map enough before filling the areas. Indeed, the filling precision depends on the zoom level. You can now fill all the wanted areas. If you can't fill an area with only one click because of the zoom level, you can complete the filling by clicking on another area and holding CTRL + Shift pressed. When all the wanted areas are filled, you can select them (by holding CTRL + Shift pressed) and copy them in a new Inkscape document.
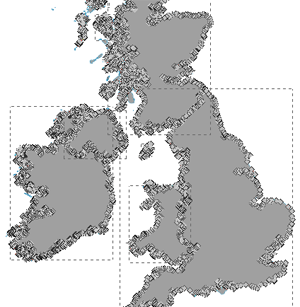
All the wanted areas are selected in order to copy them in a new document
The areas in the new document may not fit the document dimensions. In this case, go to File > Document Properties > Resize page to content, and click on the “Resize page to drawing or selection”. Resizing the document makes Inkscape group the areas in a <g> element and apply the transformation on this element. In order to translate this transformation into the path coordinates, open the XML editor (edit > XML editor) and, for each <g> element found in the XML tree, click on Object > Ungroup.
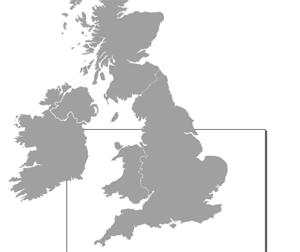
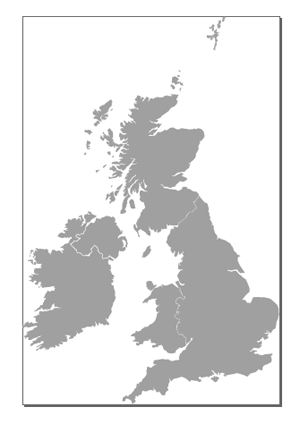
Resized page to drawing
The last step is to associate more explicit IDs than “pathXXX” to each area. To achieve this, you can use the XML editor.
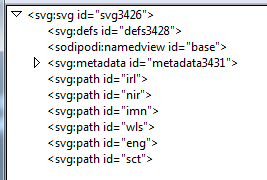
Associate more explicit IDs to the paths
Save this new SVG file. We are done with Inkscape, but you may want to go further by reading the next part.
I will not explain all the features for editing vector images provided by Inkscape because this is not a tutorial dedicated to the tool, but some of them are very useful for refining the maps.
If your final JavaScript map is too big, you can lighten the path data with Inkscape by using the tool “Path > Simplify”. You can also round the path coordinates when you build the JSON map file. A precision of 2 decimals is usually enough.
Sometimes, a single area is divided into several distinct SVG paths. Inkscape allows you to gather these paths into one single path: select all paths to be combined (by holding Shift) and use the tool “Path > Combine”.
In some other cases, you may want to break apart areas that are gathered in one single SVG path. This is what the “Path > Break apart” tool is for.
As SVG is just XML, you can open the file with any text editor. You just have to manually extract the wanted path data (‘d’ attribute in <path> elements) and path IDs (‘id’ attribute in <path> elements) in order to build the JSON map for Mapael. It should look something like this:
(function($) {
                $.extend(true, $.fn.mapael,
                    {
                        maps :{
                            yourMapName : {
                                width : 600,
                                height : 500,
                                getCoords : function (lat, lon) {
                                    // Convert latitude,longitude to x,y here
                                    return {'x' : lat, 'y' : lon};
                                },
                                elems : {
                                    // List of SVG paths for building the map
                                    "department-29" : "m 37.28,156.11 c -1.42,1.23 -3.84,1.18 (...)",
                                    "department-22" : "m 77.67,146.73 c -2.58,0.94 -4.37,2.6 -5.78,4.84 1.21 (...)",
                                    (...)
                                }
                            }
                        }
                    }
                );
            })(jQuery);
The easy way: go to the "SVG to Mapael" tool and submit your brand new SVG file to get the JS file generated for Mapael. You can set a value for the round precision field in order to round all the path coordinates, which lightens the size of the output. A round precision of 2 is usually enough. Leave this input blank if you do not want to round the path coordinates.
Rounding the path coordinates reduces the size of the output. A precision of 2 decimals is enough in most cases.
Save this in a JavaScript file and your map should now be ready to be loaded into jQuery Mapael!
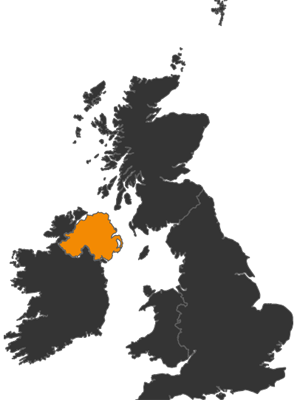
The UK map displayed through jQuery Mapael
If you want to go further with your map, you may want to plot cities by latitude and longitude on it. We assume that the projection of your map is an equirectangular one.
With this projection, the algorithm to convert a latitude and a longitude to x and y coordinates is as simple as this:
You just have to find the proper values for xFactor, yFactor, xOffset and yOffset in order to be able to plot cities by latitude and longitude on your map.
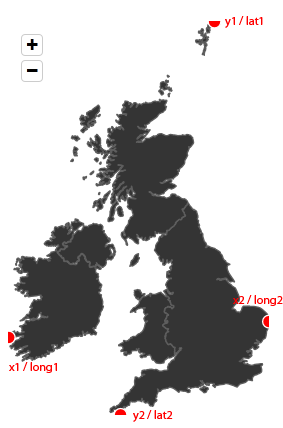
To get the values of xFactor and xOffset, you just have to solve an equation with two unknowns. Plot two points at the far left and the far right of your map with x and y coordinates. Go to Google Maps in order to find the matching longitudes for these two points (Right click > More info about this place on Google Maps) .
You can now find the values for xFactor and xOffset by solving this equation:
Then, you have to do exactly the same thing to get the values of yFactor and yOffset with matching latitudes.
You can use the getCoords() generator tool, which will solve the equations and generate the getCoords() method for you!
Use Mapael for plotting points in order to find min x, max x, min y and max y coordinates. Here is an example for the United Kingdom map where I plotted four points with x and y coordinates on the map:
(function($) {
            $(function(){
                $(".container1").mapael({
                    map : {
                        name : "united_kingdom",
                        zoom: {
                            enabled:true
                        },
                        defaultPlot : {
                            size:5,
                            attrs: {
                                fill:"red",
                                stroke:"white",
                                "stroke-width":2,
                                opacity:0.5
                            }
                        }
                    },
                    plots : {
                        p1 : {
                            x:647,
                            y:3
                        },
                        p2 : {
                            x:352,
                            y:1238
                        },
                        p3 : {
                            x:1,
                            y:995
                        },
                        p4 : {
                            x:818,
                            y:945
                        }
                    }
                });
            });
Then, you can use Google Maps in order to find the matching latitudes and longitudes for these points, and fill in the form of the getCoords() generator.
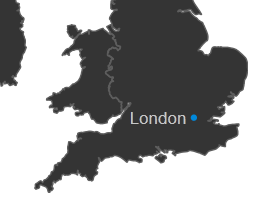
With the getCoords() function added to your JS vector map, you can now plot cities by latitude and longitude, here is an example with London plotted on the UK map (latitude: 51.5085300, longitude: -0.1257400):
Your map for Mapael is now complete! Take a look at the Mapael documentation to see what you can do with it. Feel free to contribute to the mapael-maps repository (https://github.com/neveldo/mapael-maps) by adding your new map!
 Github